Read Data
This article covers the Data page and the options for listing, sorting and grouping the table names.
Data Home Page
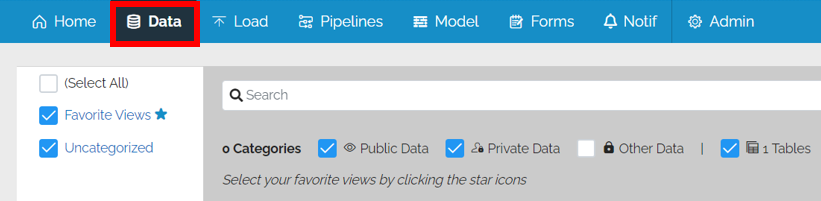
Select Data to see a list of tables and select one to view the data.
This will bring you to the data page.
Initially, the table names will be displayed as tiles. In the top right is an action menu.
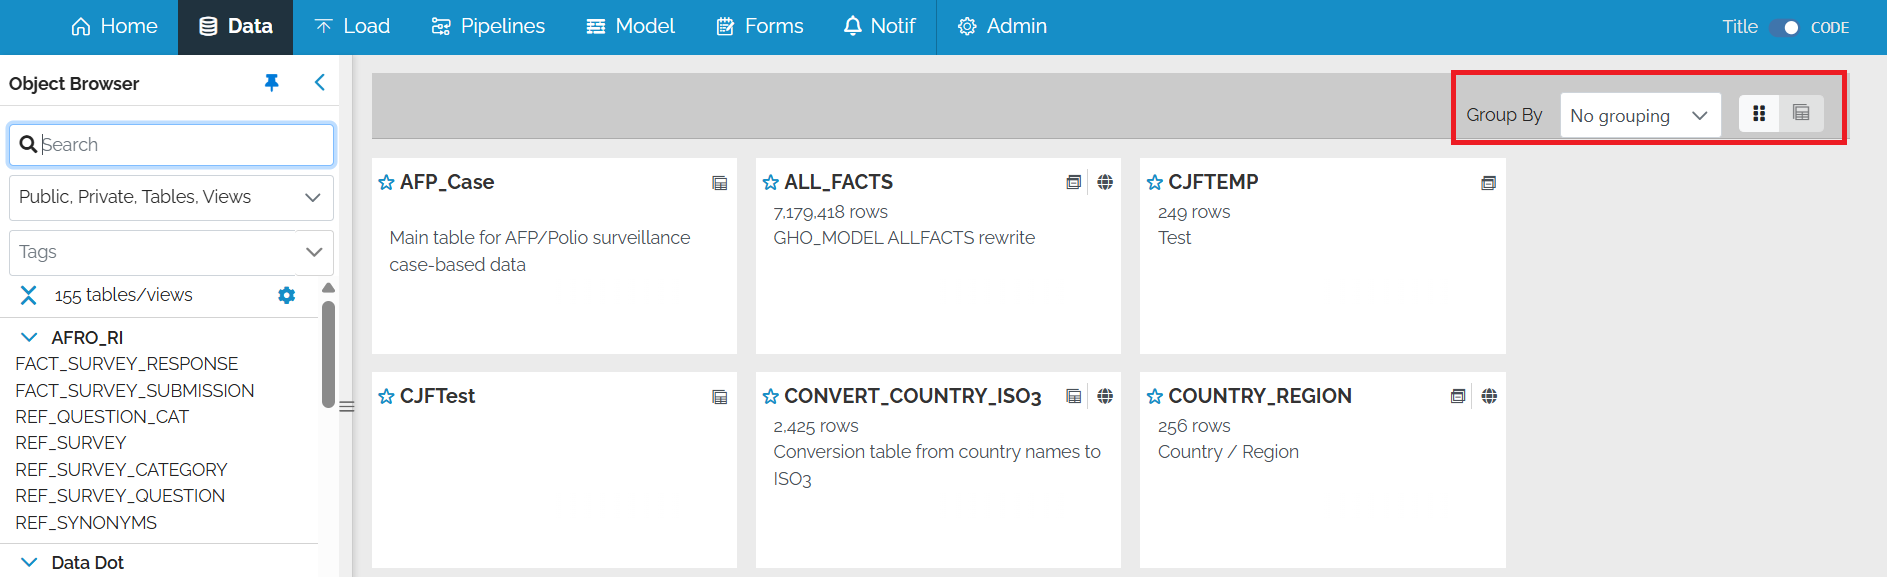
Toggle between Tiles and List
One of the options allows you to toggle between list and tiles
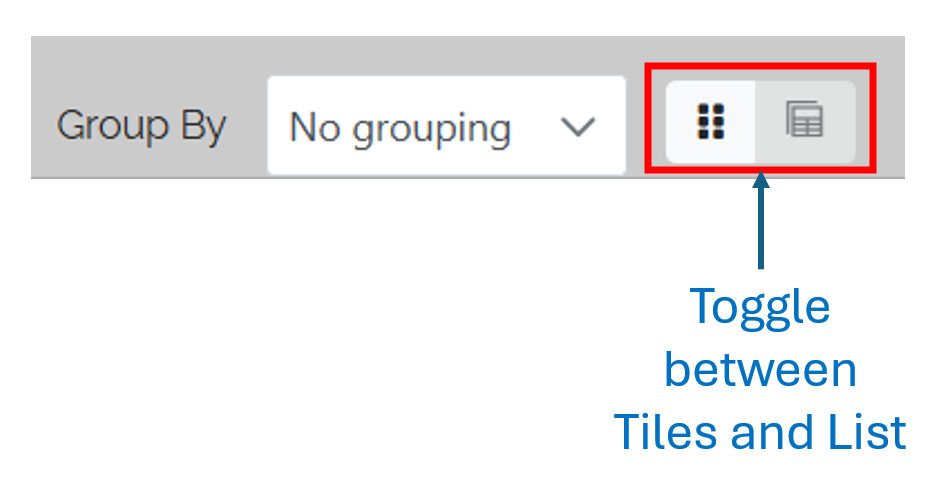
Table Grouping Options
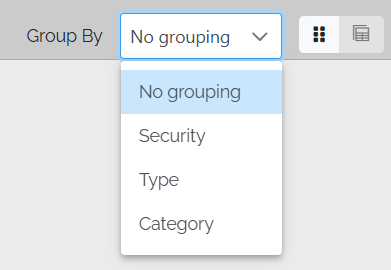
The tables can be displayed according to grouping categories.
| Option | Function |
|---|---|
| Security | Groups by Private / Public |
| Type | Groups by Tables / Views |
| Category | Groups by Category |
Table Grouping for Tiles and Lists
The list / tiles on the right of the screen can be displayed according to the grouping categories.
This is also available in the list of tables on the left of the screen
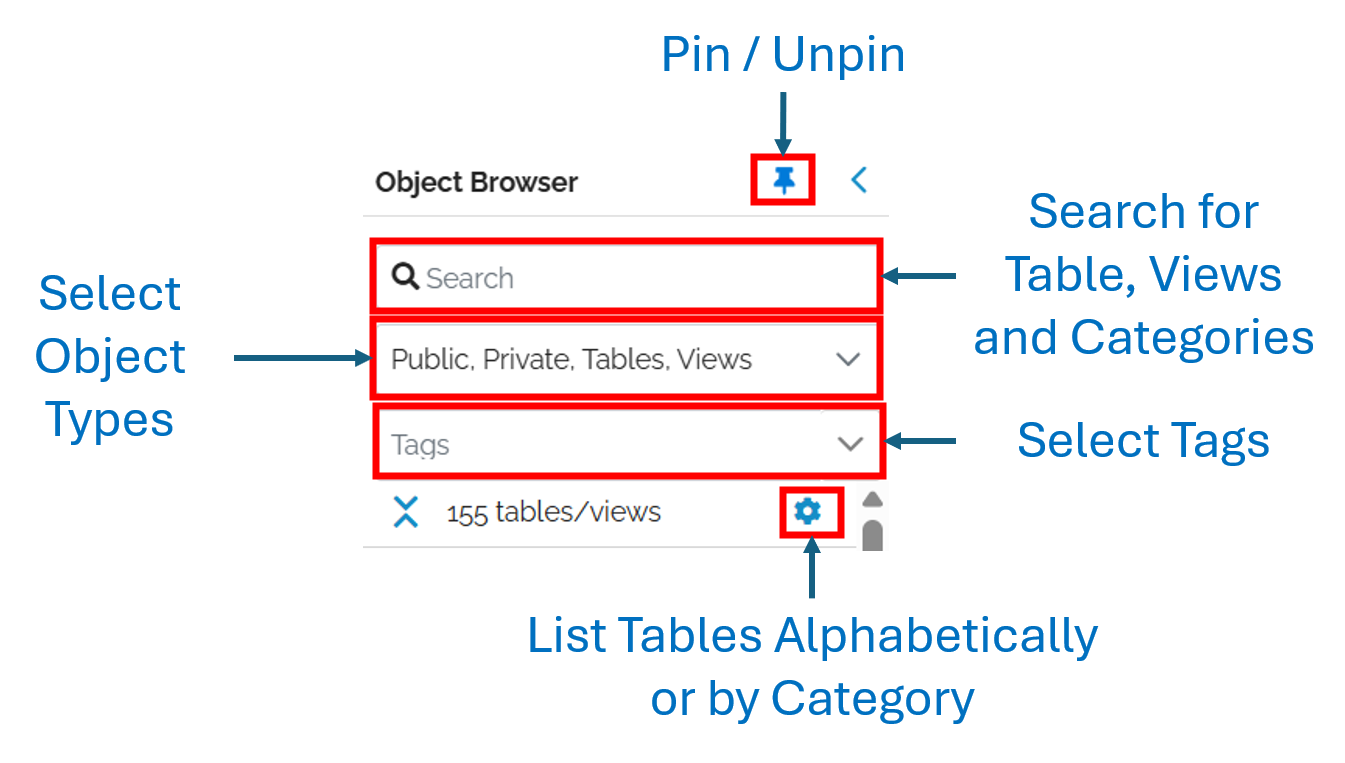
Object Browser
On the left of the Data Page is the Object Browser. At the top is tha action panel
View a Table
Select a table to see the data.
The data will appear with a set of tabs
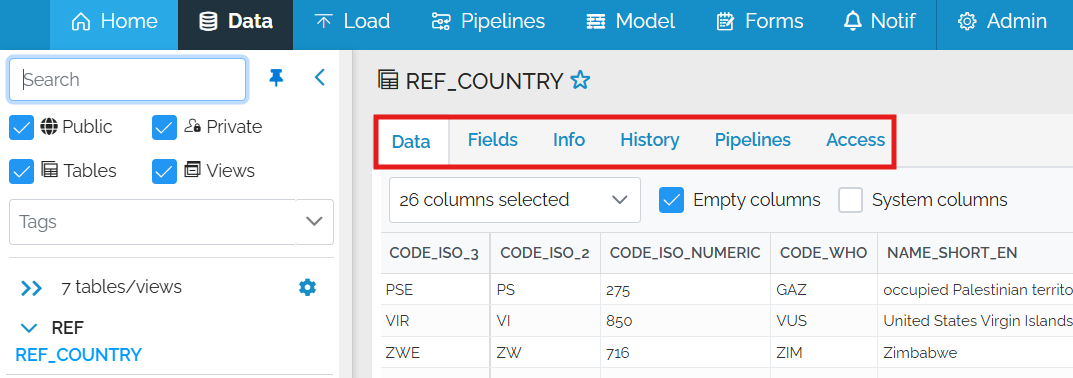
Data Tab
The data tab shows the first page of data and allows for various ways to see it.
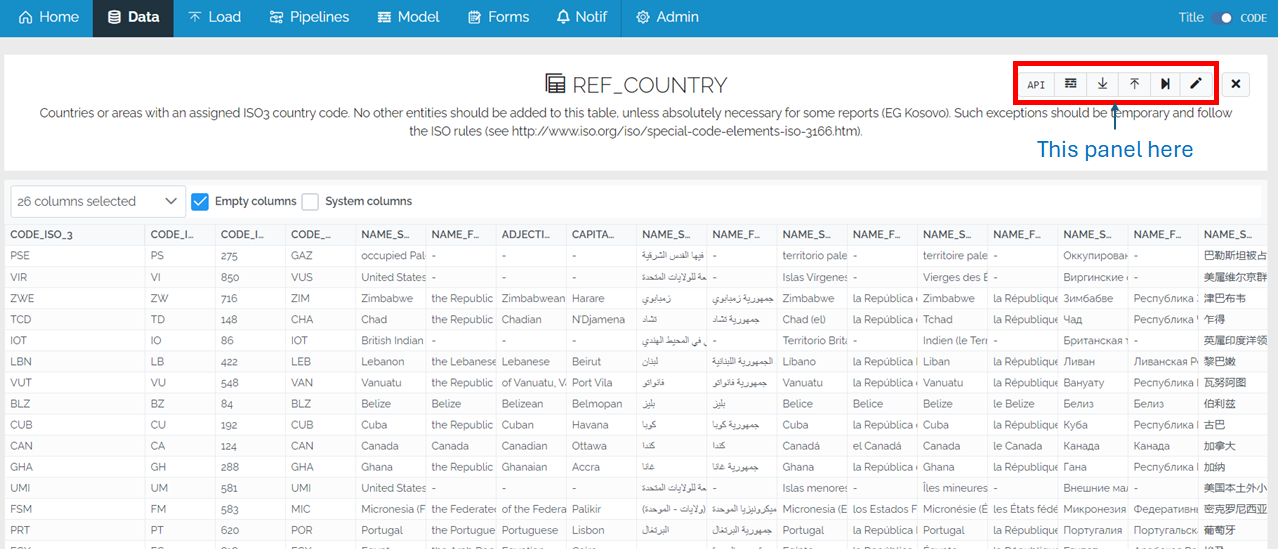
The Data Action Panel
In the top right, there is a Data Action Panel
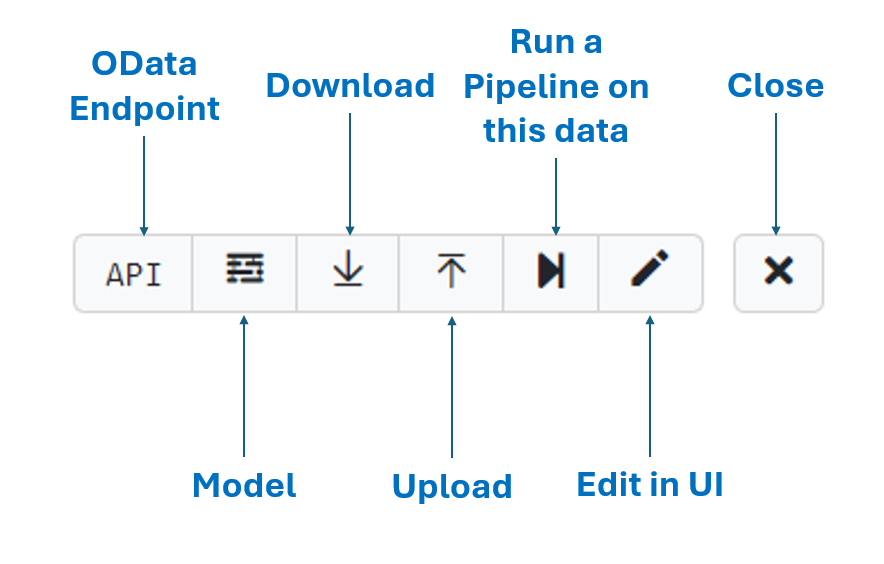
| Action | Description |
|---|---|
| Switch to Old Table Component | Reverts back to the previous version of the grid. This is there in case the user has any problems with the newer grid |
| OData Endpoint | See Use the OData API |
| Model Page | See Edit Model via UI |
| Download | See Download data |
| Upload | See Upload data |
| Run a Pipeline on this data | See Pipelines Overview |
| Edit in UI | See Edit Data in UI |
| Close | Goes back to the main data page |
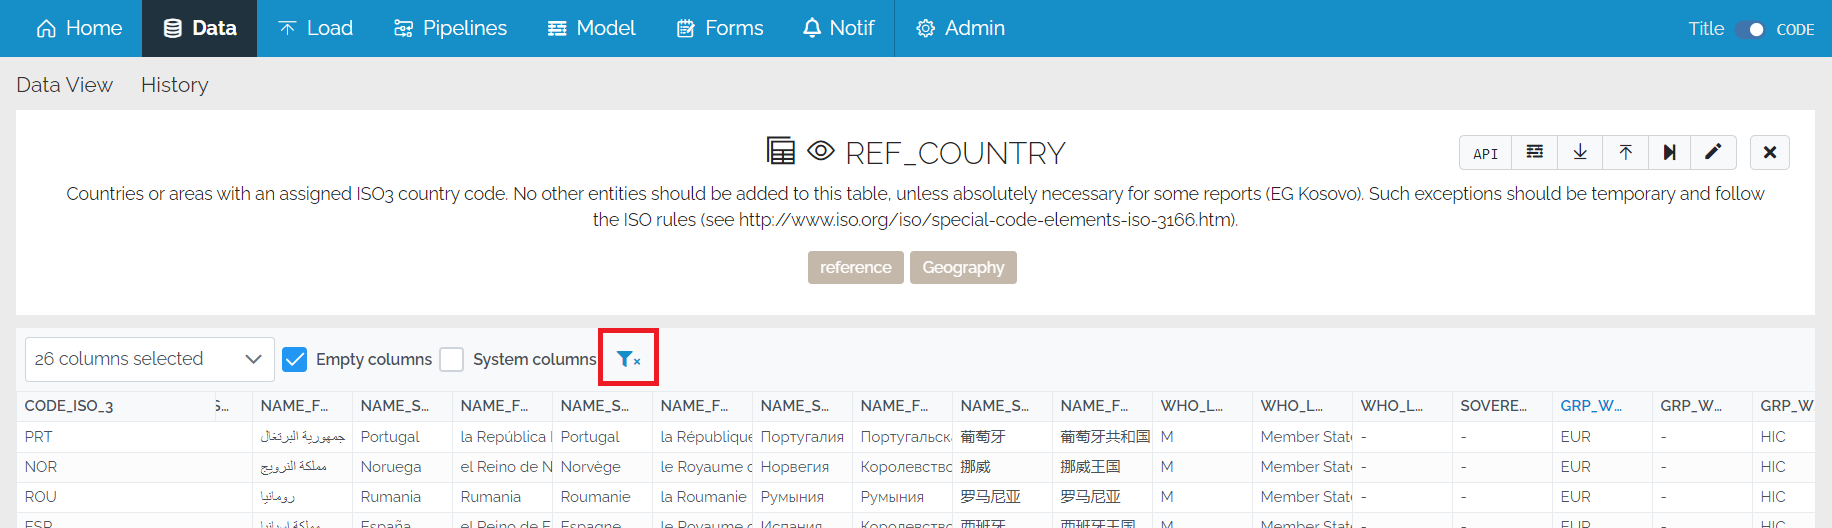
Column Picker
By clicking on the down arrow of the column picker, the user can select which columns they wish to see
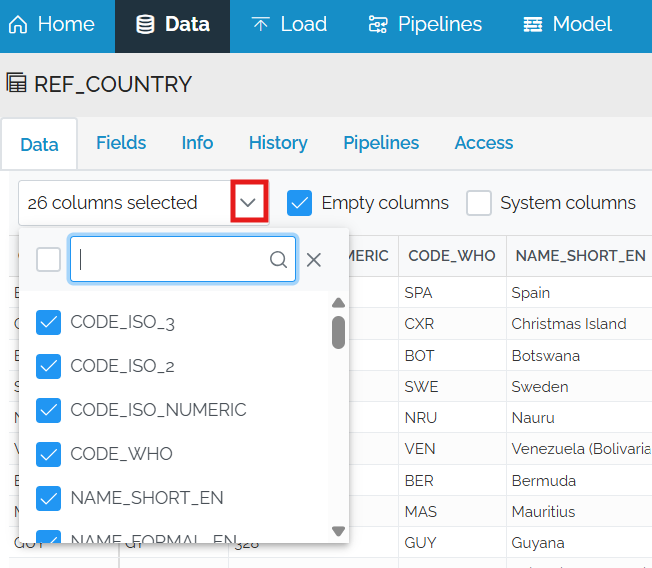
There are also options to hide empty columns and show system columns.
Filtering and Statistics
In order to filter and view the statistics on a column, click on the heading. In this case, we are going to look at the region codes in REF_COUNTRY.
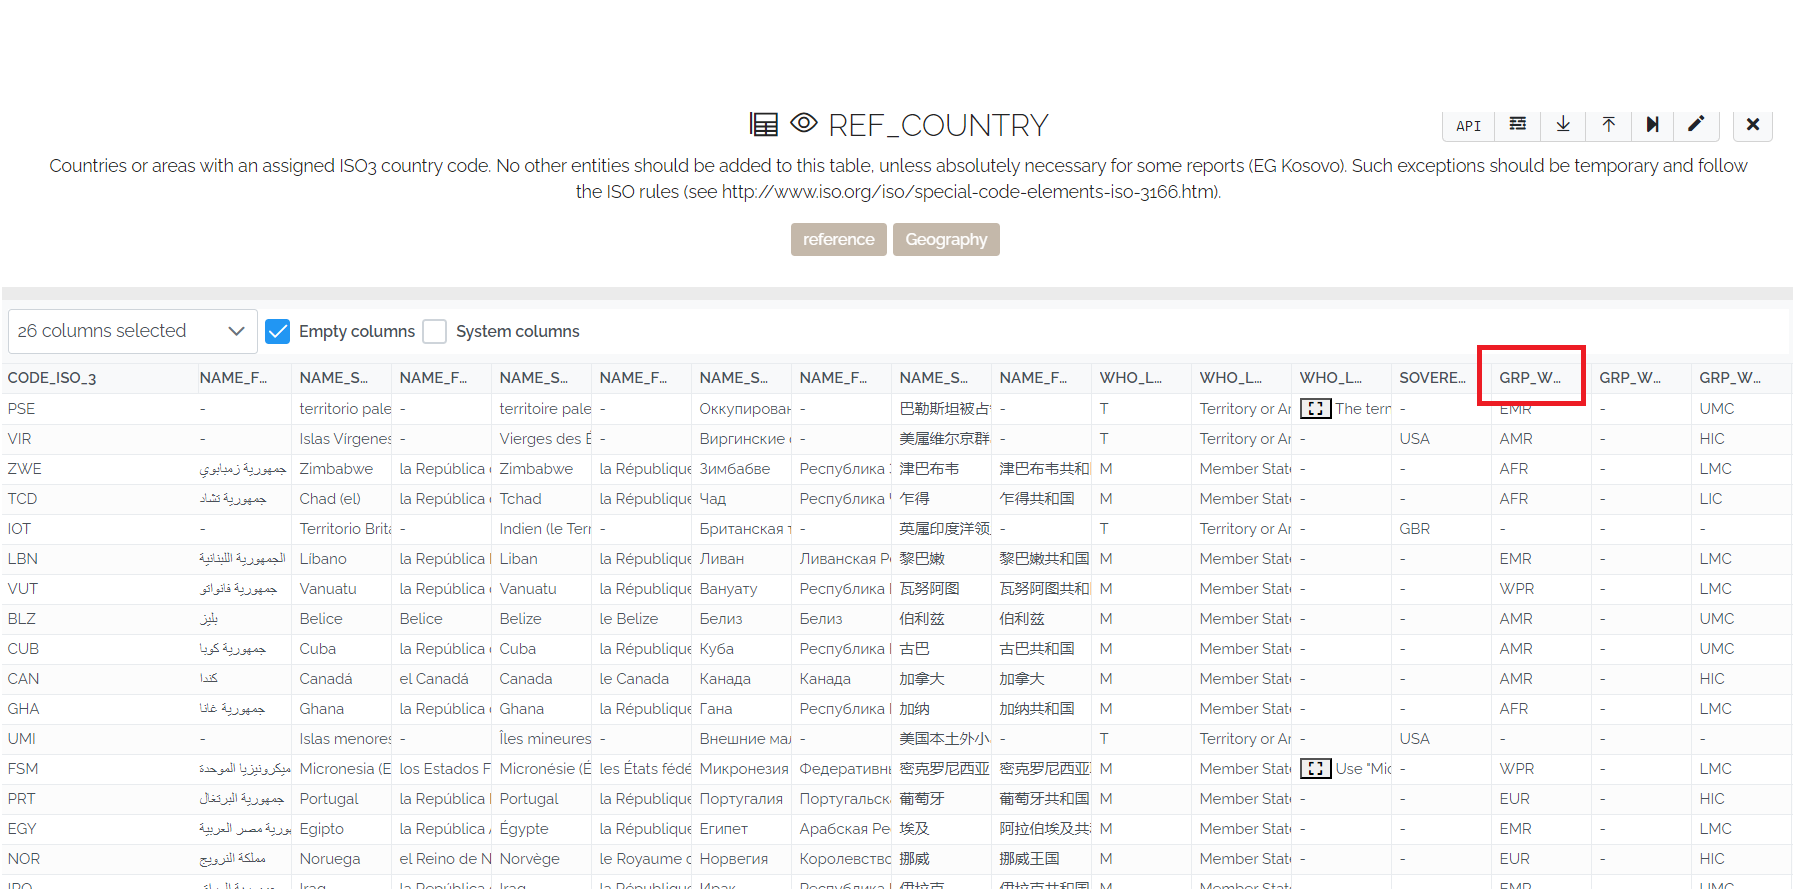
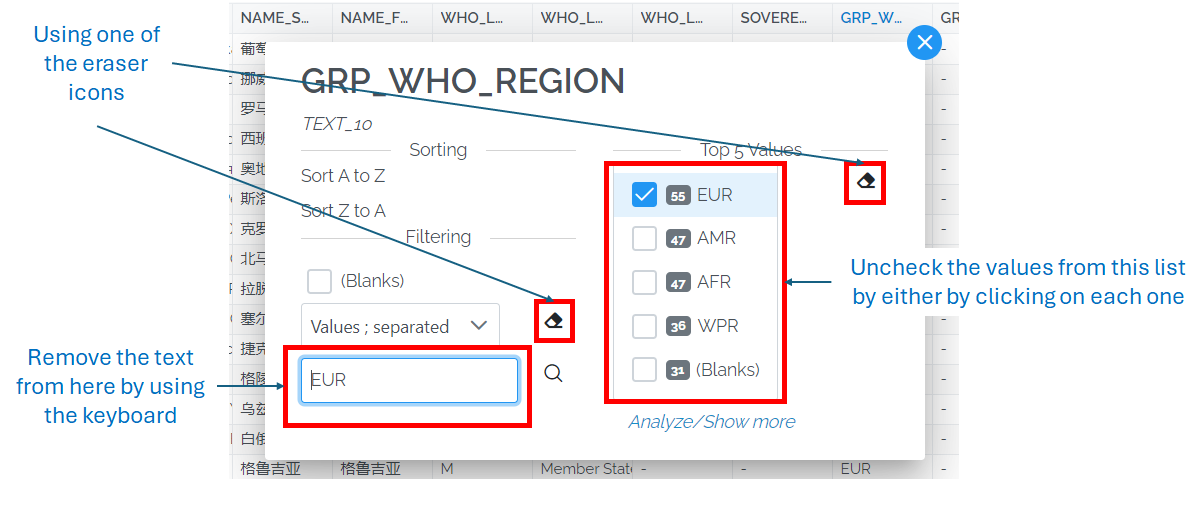
This will bring up the Column Pop-up
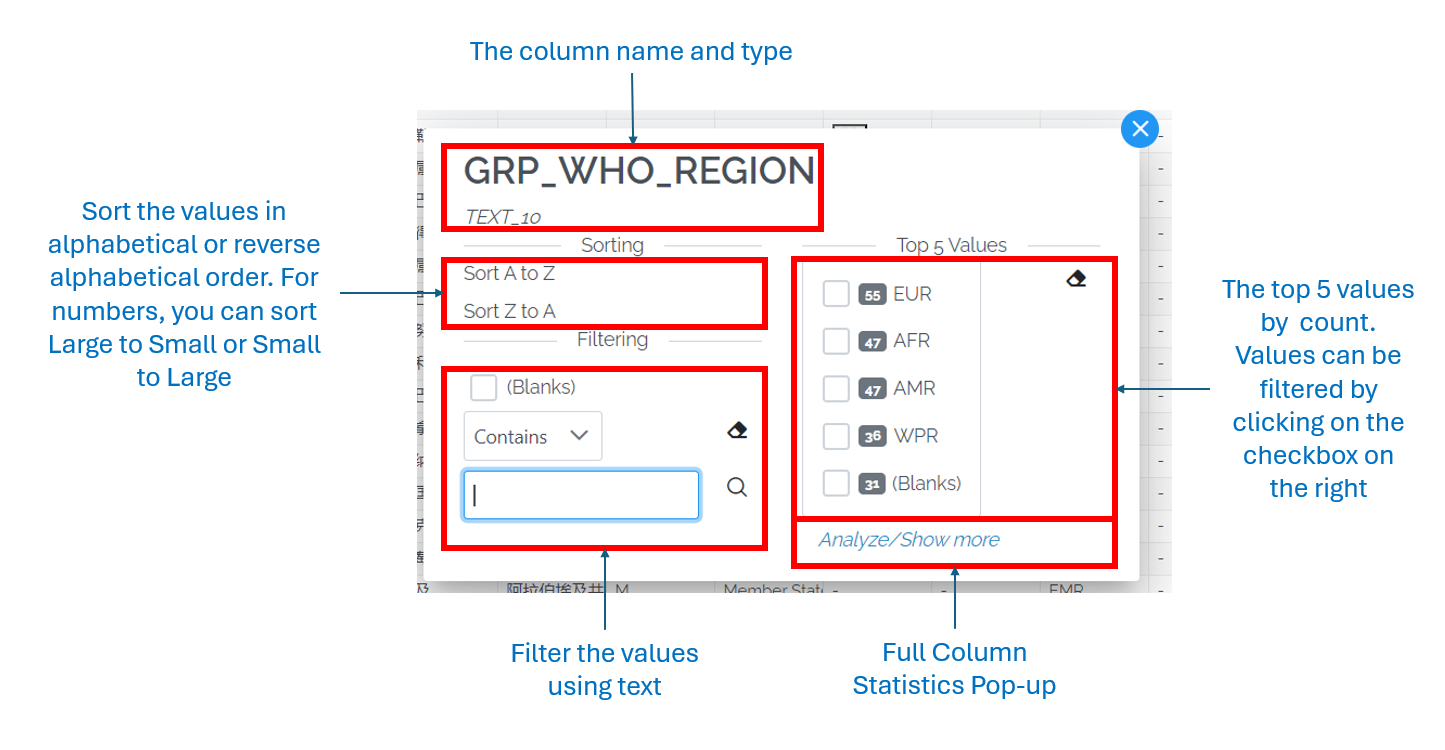
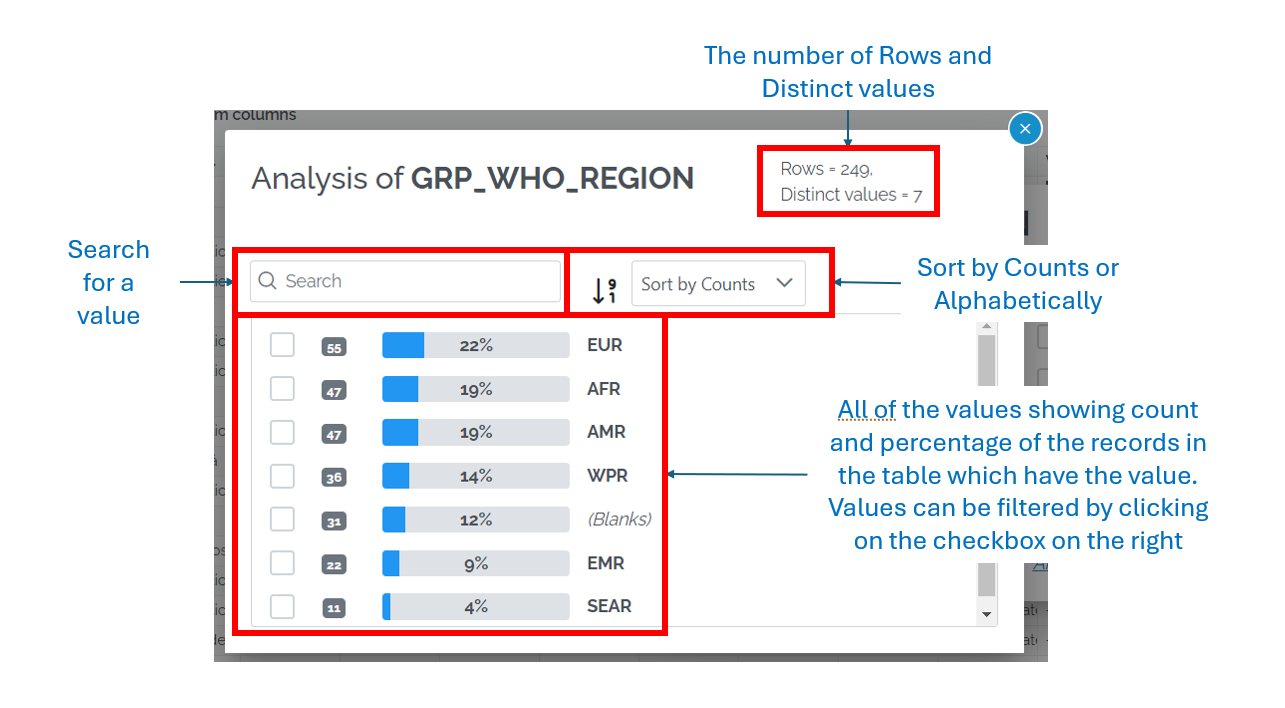
On the left is a box showing the top 5 values with the count of the records for each value. At the bottom is an Analyze/Show more button which brings up an Analysis for all of the records.
By clicking next to one of the values, you can filter the data.
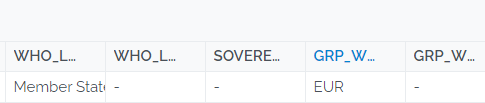
If a column has been filtered then the title colour changes to blue
Removing a filter
There are several ways to remove a filter
The first is by using the funnel directly on the data page
You can also do it from the column pop-up-box
Fields Tab
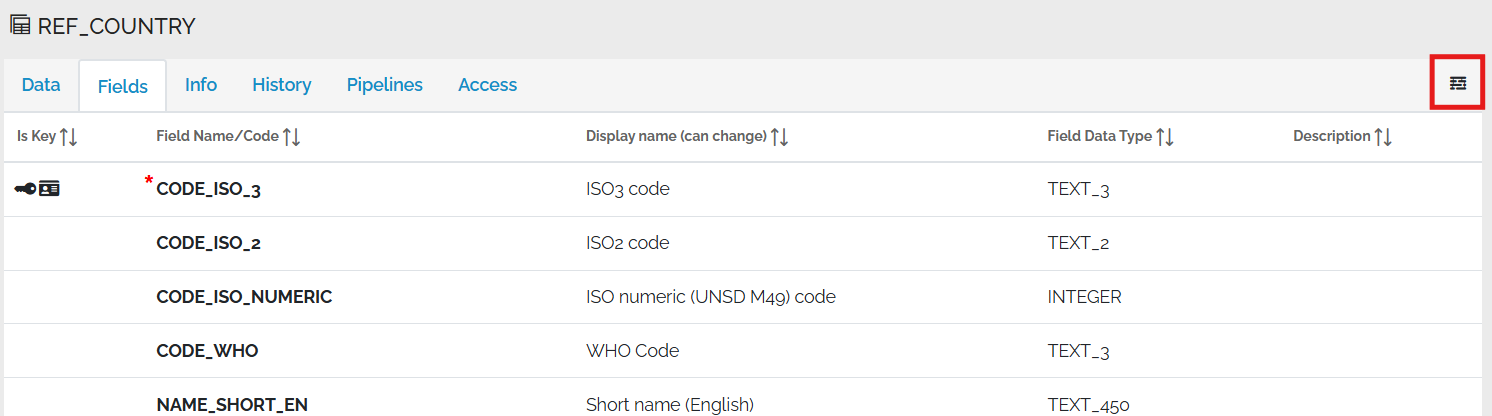
The fields tab gives a list of fields in the table / view. In the top right, there is a shortcut to the Data Model Page
Info Tab
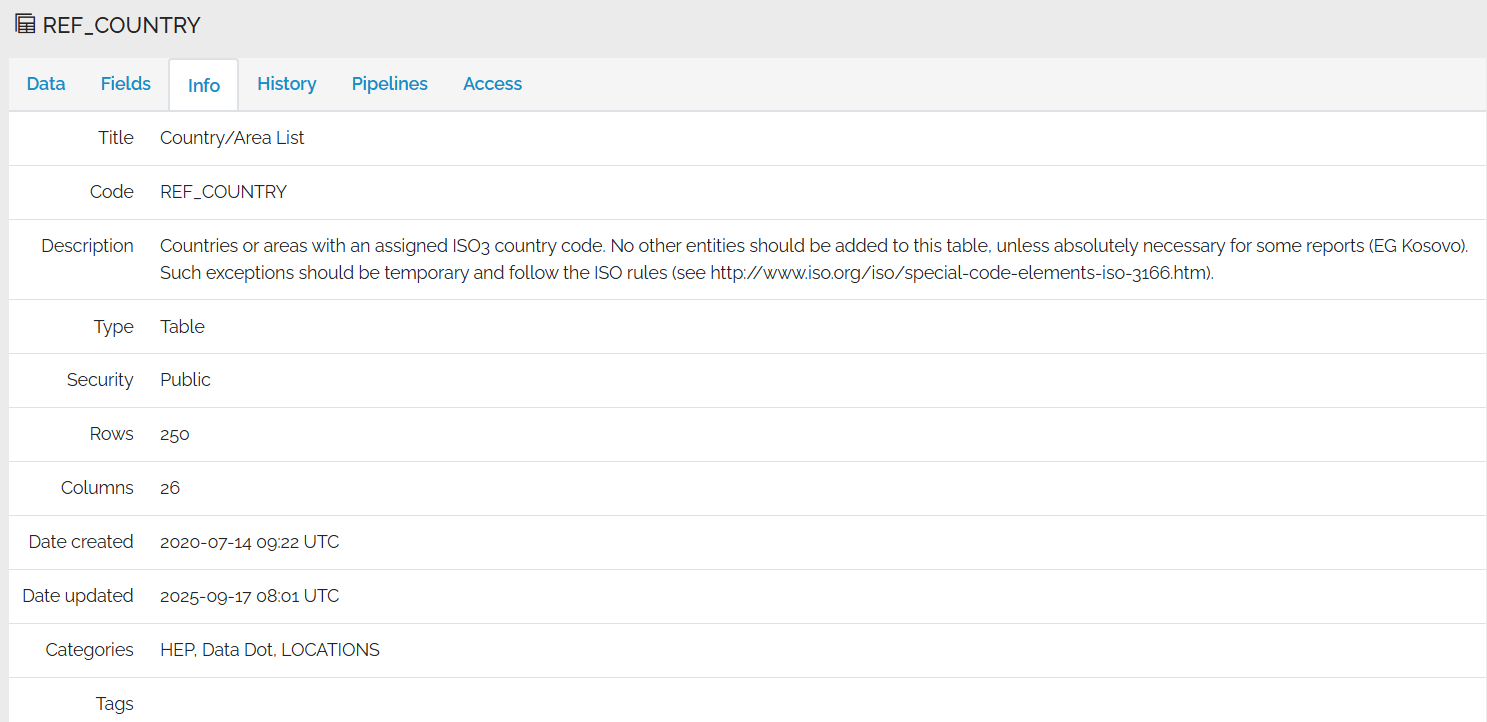
The Info in the Info tab comes from the model
History Tab
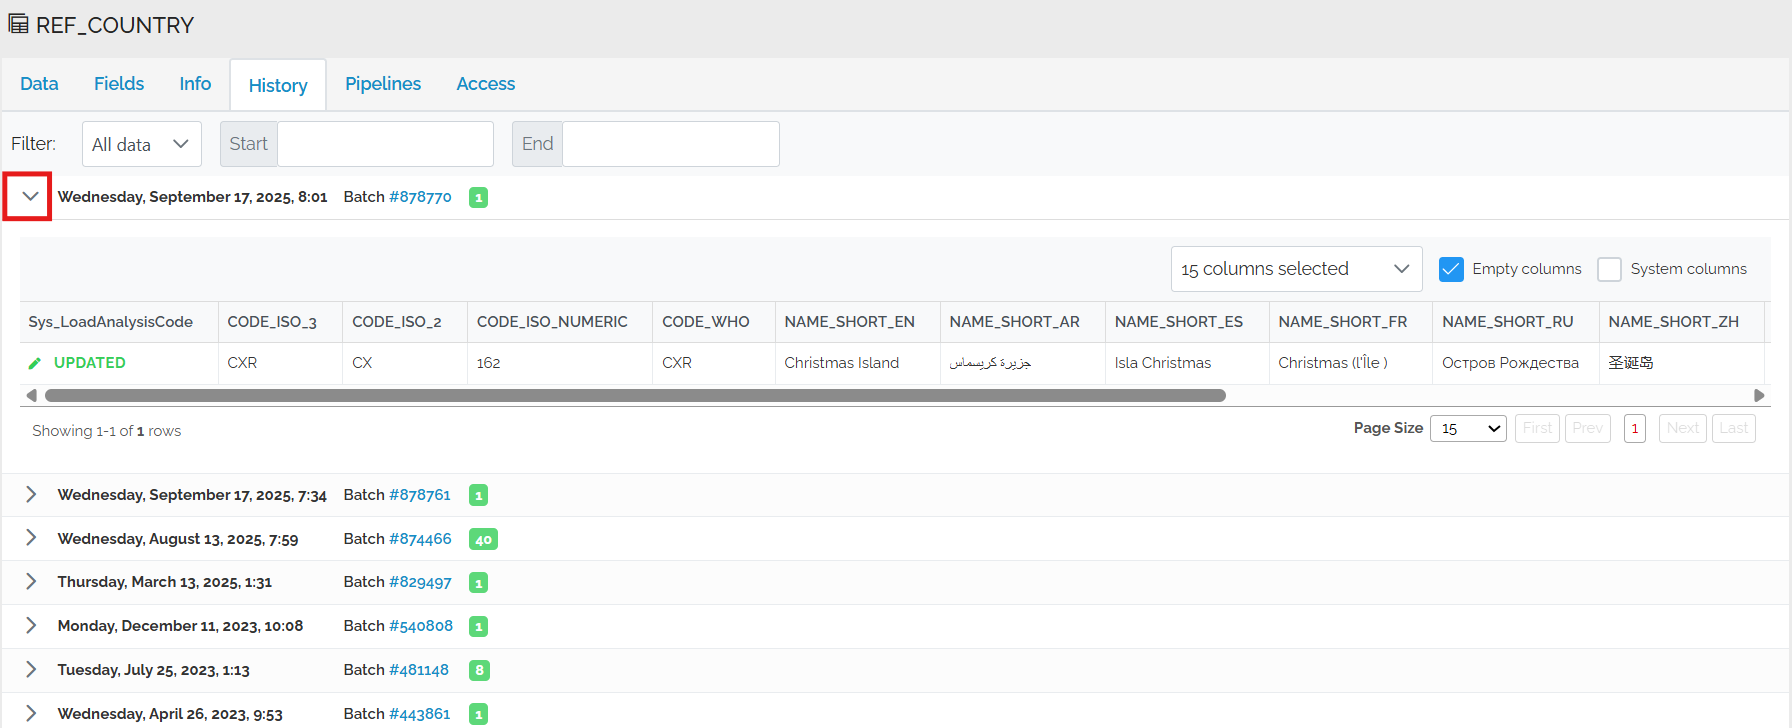
The History tab gives a list of all of the changes which have been done to the data. Click on the arrow on the left of the change to find out more details about it.
Pipelines Tab
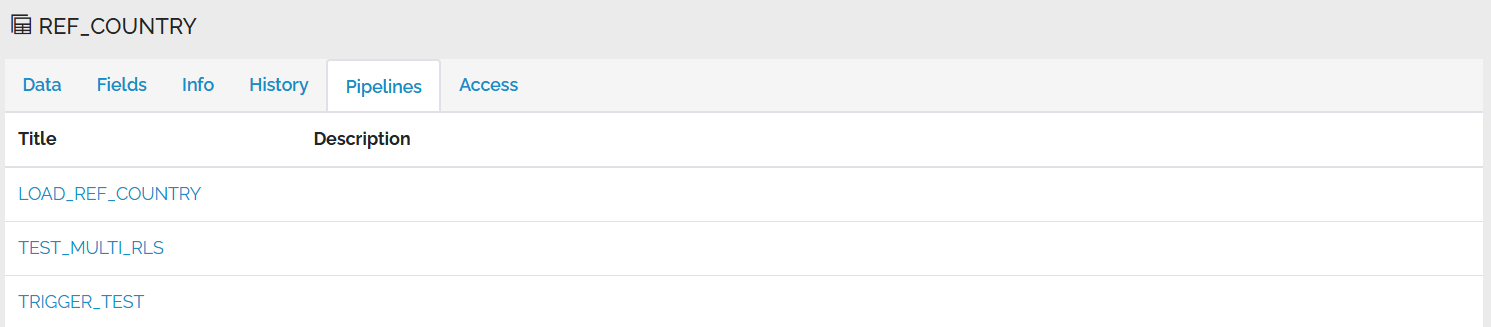
This tab shows all of the pipelines which make changes to the table. Click on the code to go to the Pipeline Editor
Access Tab
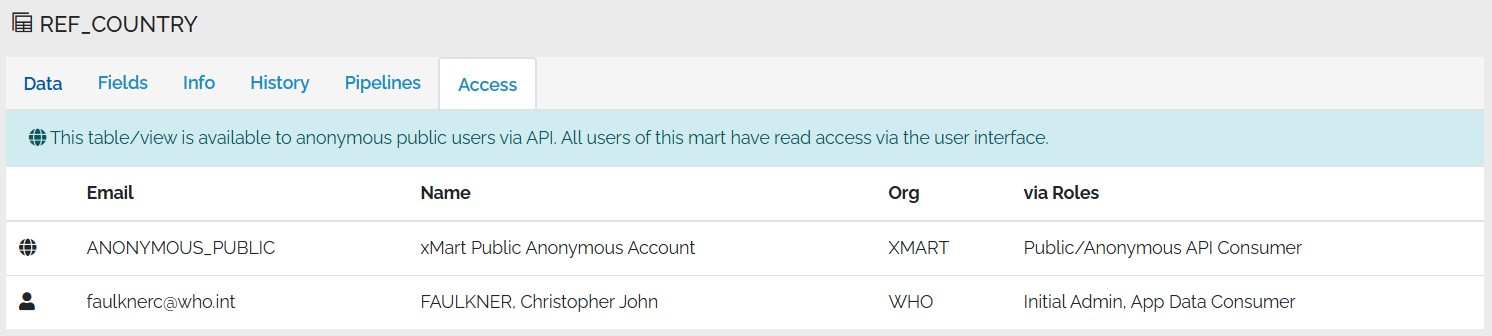
This tab lists people users but also client applications (external applications) and xmart service accounts (other marts) which have access to the table/view.
A prominent message is displayed if the table/view is available to the anonymous public via API.
Click on any row of the Access tab to open that user for editing in the Admin area.