

Title
Why
This activity is not explicitly required by ISO. However, making flowcharts of all the laboratory’s key processes is a good method to determine which SOPs still need to be developed. It is also one of the first steps in the Failure Mode Effect Analysis that will be done in phase 4. This will lead to formulation of preventive controls and internal quality controls.
What
In this tool we follow the method of performing a Health-Care Failure Mode Effect Analysis (HCFMEA). The procedure for this method is described in detail on this website. In this activity we are going to do only step 1, 2 and 3 described here.
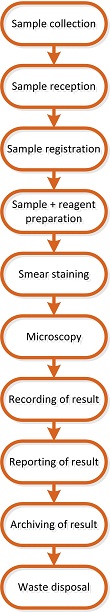
The first step is determining which processes need to be analyzed. This is in the first place the primary process of the laboratory which is described in the figure below.
The second step is assembling a team, consisting of one or two experts in the process to be analyzed and a team leader who preferably has no professional knowledge of the primary laboratory process so that this person can purely focus on the conduct of the process analysis.
The third step is conducting the process analysis. Divide each process identified in step 1 in process steps. Describe for each step the sub process as described here.
How & who
Laboratory Manager:
- Explain the principle of making process flowcharts to the heads of the sections and explain why they have to make the process flowcharts.
- Determine with the head of each section the key procedures being performed in their section.
- Make process descriptions with the head of each section for each procedure identified in the previous step. Follow the explanation of step 3 as described above and one the website which is linked to.
NOTE: Archive the flowcharts carefully as they will be used again in phase 4 for the failure-mode-effect-analysis.
| ISO15189:2007: |
| ISO15189:2012: |
| ISO15190:2003: |
Search this site
Questions on how it works?
Legend
![]() Tool
Tool
![]() Background information
Background information
![]() Template
Template